Infographic

INFOGRAPHIC – BLACKBOARD USE @GVSU FOR FALL 2019

Blackboard by the numbers…

Here is an infographic with a few stats, highlighting the use of Blackboard at GVSU in the Fall 2019 semester:

bbstats-2019_41917149 (1).png


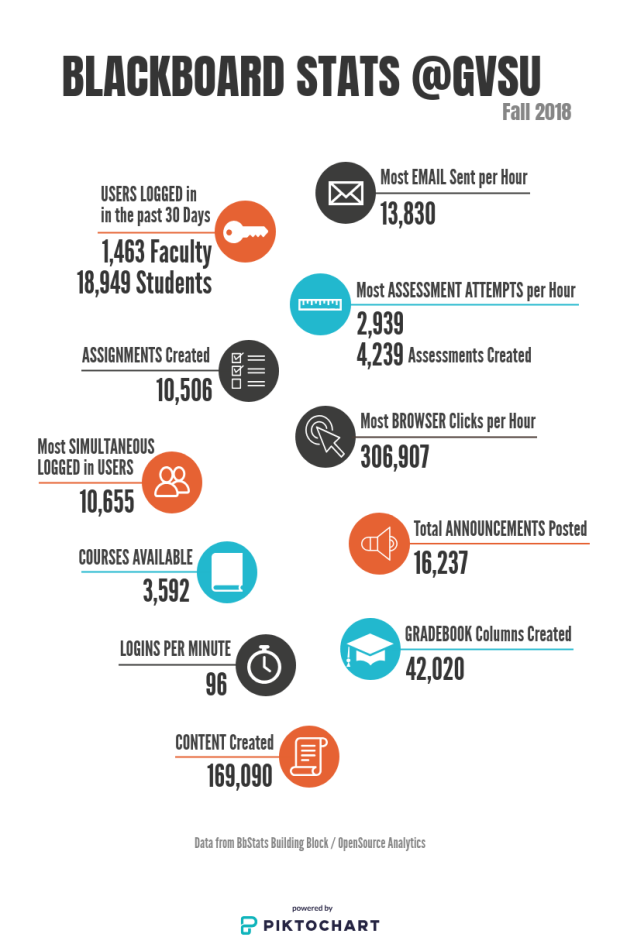
Data in Infographic:

  • Users Logged in past 90 Days
    • 1,394 Faculty, 20,902 Students
  • Assignments Created
    • 14,366
  • Most Simultaneous Logged in Users
    • 17,028
  • Course Sections Available
    • 3,510
  • Logins per Minute
    • 121
  • Content Items Created
    • 238,486
  • Most Email Sent per Hour
    • 18,541
  • Most Assessment Attempts per Hour
    • 2,106
    • 7,710 Quizzes / Tests Created
  • Discussion Forum Created
    • 9,194
  • Total Announcements Posted
    • 39,225
  • Gradebook Columns Created
    • 61,132

BLACKBOARD STATS @GVSU – FALL 2018

This post features a few insights around Blackboard use at GVSU in the Fall 2018 semester. Highlights include:

  • Users Logged in in the past 30 Days
    • 1,463 Students
    • 18,949 Students
  • 10,655 Most Simultaneous Logged in Users
  • 3,592 Courses Available to Students
  • 42,020 Gradebook Columns Created
  • 169,090 Content Items Created

Infographic showing Blackboard usage that includes: 18,949 students and 1,463 faculty users having logged in in the past 30 days.

These data are gathered from the BbStats OpenSource Blackboard Building Block.